Duration
About 3 hours
You set every stage timing from the professor panel, so it fits one block or splits across two sessions.
Commodities Simulation
The Finsimco Commodities Simulation gives each student four forward curves with different shapes and a position that has to be rolled every month. The spot price then goes nowhere for a quarter, and the four returns differ anyway.
Duration
You set every stage timing from the professor panel, so it fits one block or splits across two sessions.
Format
Each student holds the curve, roll and position roles in turn and submits one commodity position.
Level
Adjustable: one commodity in steady contango, up to storage and convenience yield and a curve that flips.
Professor tools
Manage students, adjust stage timings, control progression and monitor individual inputs.
Prerequisites
Students need to know what a futures contract is. Forward curves, roll yield and convenience yield are taught inside.
Delivery
The web-based simulation supports in-person, remote, blended and homework-supported delivery.
Assessment
Every submission is individual, so the roll schedule, the realised return and the review answers export per student.
Course fit
Designed for Commodities, Derivatives, Financial Markets, Investments and Energy Finance courses.
The topics a commodities module has to cover: forward curves: contango and backwardation, roll yield, storage cost and convenience yield, the spot, roll and collateral return, rolling a futures position and physical tightness and the curve.
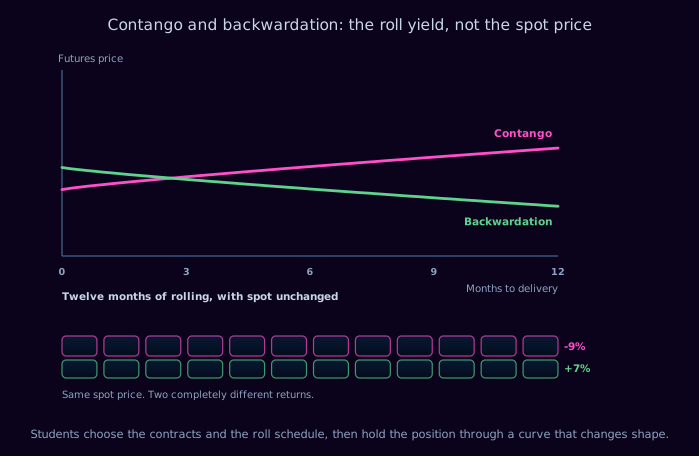
The picture that explains the gap between a commodity's price and a commodity investor's return. A futures position has to be rolled: the expiring contract is sold and a later one bought. In contango the later contract costs more, so every roll loses a little and twelve of them lose a lot. In backwardation the later contract is cheaper and the roll pays. The spot price is the same in both panels, and the twelve-month outcomes differ by sixteen percentage points.
Written to drop into your module descriptor without rewriting. On completing the simulation, your students will be able to:
Each student runs the desk alone, holding the curve, roll and position roles in turn. All three want something different from the same four curves, and only one position is submitted.
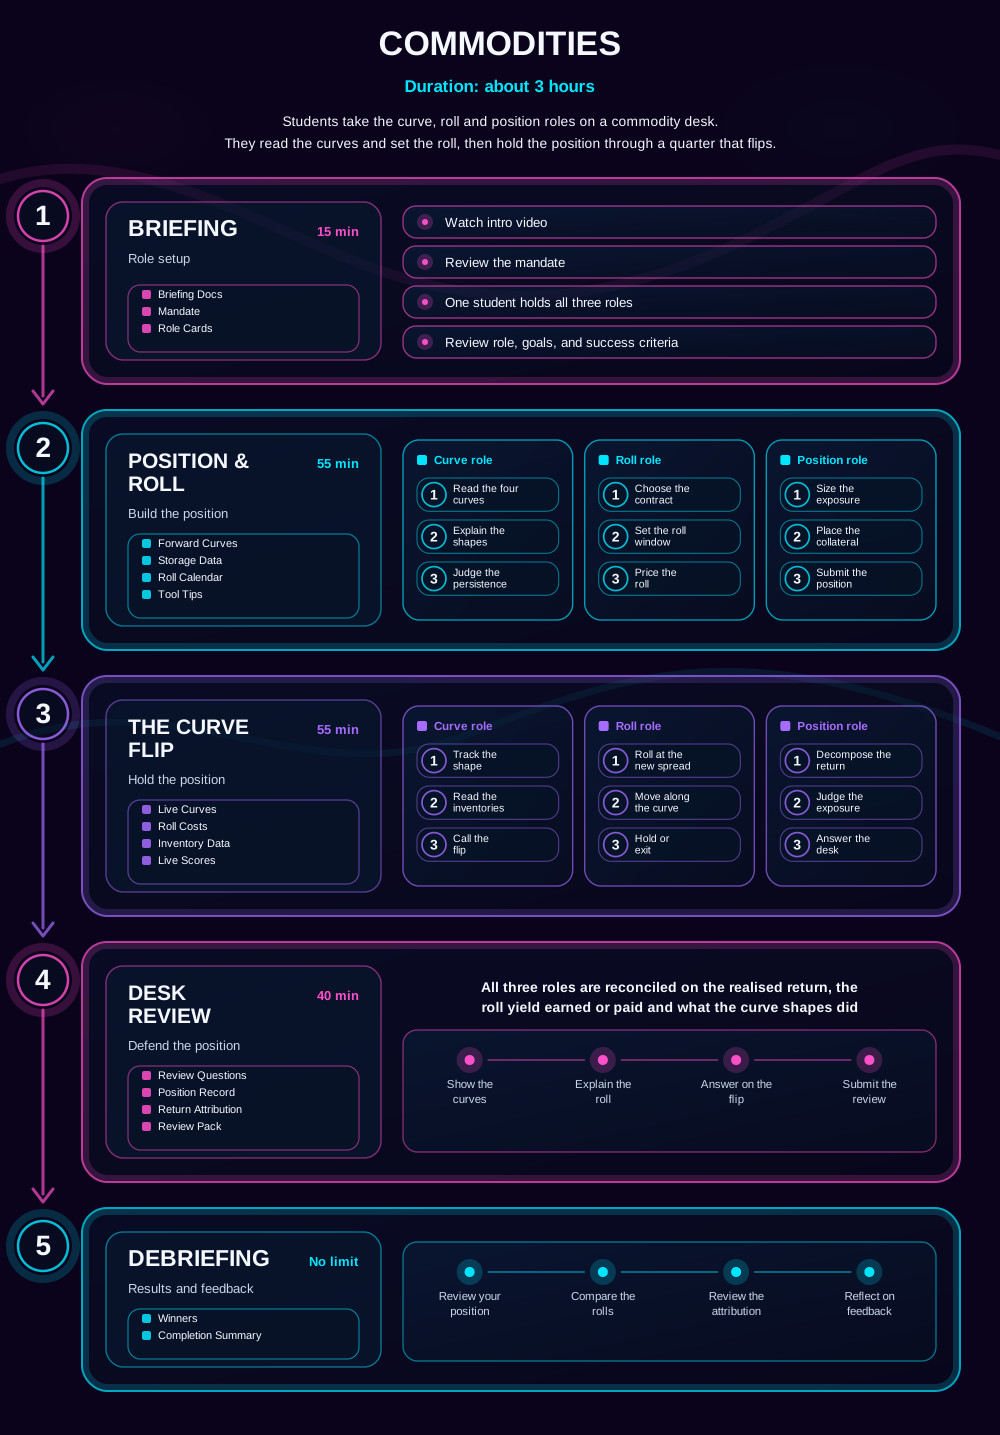
The gameflow every student sees before they start. The three roles come into play during the build and the flip; briefing, the desk review and the debrief are worked as a single view. Materials arrive stage by stage: mandate and role cards at briefing, then the forward curves, storage data and roll calendar for the build, then the live curves, roll costs and inventory data once the quarter starts.
Students read four forward curves, decide what each is saying about storage, carry and physical availability, and judge whether the shape is likely to hold.
Students choose which contract to hold and when to roll it, knowing that in contango every roll sells cheap and buys expensive.
Students separate the spot return, the roll yield and the collateral return, and say which of the three the position is actually earning.
Five stages. Students read four forward curves, build a position that must be rolled, then hold it through a quarter in which one curve flips.
Briefing Docs · Mandate · Role Cards
Briefing
Students watch the intro video, review the desk mandate and take on all three roles, checking the exposure required, the roll policy and the success criteria before any contract is chosen.
Forward Curves · Storage Data · Roll Calendar · Tool Tips
Position & Roll
The position gets built. Working as curve, the student reads forward curves for crude, natural gas, copper and corn and explains the shape of each; as roll, chooses which contract to hold and when to roll, with the option of going further out to reduce the cost; as position, sizes the exposure and places the collateral. The position is submitted with the expected roll yield stated.
Live Curves · Roll Costs · Inventory Data · Live Scores
The Curve Flip
A cold quarter draws down natural gas inventories and that curve flips from contango into backwardation, while crude's contango steepens. The spot prices of both finish the quarter within one per cent of where they started, and the two positions return plus seven and minus nine per cent, entirely through the roll.
Review Questions · Position Record · Return Attribution · Review Pack
Desk Review
Students are asked to decompose the quarter's return into spot, roll and collateral, explain why two flat commodities produced opposite results, say whether the natural gas flip was predictable from the inventory data, and state what they would hold differently.
Winners · Completion Summary
Debriefing
Students review their own position, compare roll schedules across the cohort, revisit the attribution that separated them and reflect on the feedback. Winners and the completion summary give you a structure for the discussion.
The student interface carries the curves, the roll schedule and the reasoning. The professor panel carries the timeline, the controls and every individual position.
Students work commodity by commodity, with the spot price, the forward price and the roll yield the shape implies side by side, and a written reason required for every position in a steeply contangoed market.
The two return columns are the point. Spot finished the quarter within one per cent for both, and the positions returned plus seven and minus nine per cent entirely through the roll.
Your view. Adjust any stage timing, start or stop the session, and watch which students rolled into the front month of the steepest contango on the board.
Explore the student and professor experience, and discuss timing, setup and syllabus fit.
It works best as the session that separates a commodity's price from a commodity position's return.
What a futures contract is and that it expires. Forward curves, roll yield, storage and convenience yield are explained inside the activity.
Mid module, typically weeks five to nine, once futures have been introduced.
Commodity index products, hedging for producers and consumers, energy markets, inflation hedging, and any assessment asking students to evaluate a commodity allocation.
The commodities course guide sets out where it sits in a full module.
The three mistakes students make on this case, and what each one gives you in the debrief. Our simulations are designed around them: read the learning science behind it.
1
A long commodity index position is a sequence of futures rolls, not a holding of the physical. Students who expect the return to match the spot price change are surprised by a double-digit gap in a single quarter, which is the whole reason the roll is taught at all.
2
An upward sloping curve is mostly storage cost and funding, not a forecast. Treating it as a prediction leads students to buy the commodities with the steepest contango, which are precisely the ones whose roll will cost the most.
3
Rolling into the front month in a steep contango is the most expensive point on the curve, and moving further out can cut the cost substantially at the price of a less responsive position. Students who never consider the choice pay the maximum roll cost by default.
The debrief runs itself. Every student sees their results, the cohort comparison and the decisions that produced them, with nothing for you to prepare. If you would rather lead the discussion, these questions work straight from a slide, and they use what your cohort actually did.
Assessment is optional. Run the simulation ungraded as an applied activity, or use platform data as supporting evidence. Every student generates a curve reading, a roll schedule, a position, a return decomposition and written rationales. Because the simulation is single-player, every input belongs to one named student, so there is no group-work marking to untangle. All of it exports as CSV or PDF, per student, so you can assess reasoning rather than a result.
On generative AI: written rationales are exactly what marking teams now worry about. Because every rationale here is tied to a roll decision the student made inside the platform, with the realised attribution sitting next to it, the reasoning can be checked against the evidence rather than taken on trust.
93% of students rate Finsimco simulations Excellent, across more than 30,000 responses.
Teaching notes, a setup and facilitation guide and a gameflow diagram come with it, and we support your first delivery directly.
Run it ungraded the first time. Assessment is optional and can be added once you have seen how your cohort responds.
Pause or stop at any point and resume later without losing submitted data, so an overrun costs you a timetable slot, not the activity.
Read what lecturers say.
Ron Tuninga, Managing Director for EMEA at AACSB, and Victor Hedenberg, Membership Director at AMBA, on why simulation-based learning belongs in business education. Watch both interviews.
If this one is not quite right for your module, these are the closest alternatives.
What diversification is really buying.
Learn More
Building and rebalancing a global portfolio.
Learn More
Discounting, compounding and what a cash flow is worth.
Learn More
What gets measured, and what gets managed.
Learn MoreA one-page summary of this simulation, covering stages and timings, roles, concepts, learning outcomes and the debrief questions, plus a full sample teaching pack from one of our live simulations, so you can see exactly what you would be running.
During the call, we can: