Duration
About 3.5 hours
You set every stage timing from the professor panel, so it fits one block or splits across two sessions.
Capital Structure Optimization Simulation
The Finsimco Capital Structure Optimization Simulation gives each student a balance sheet, a tax shield worth having and a ratings cliff at the investment grade boundary. The downturn arrives one notch above it.
Duration
You set every stage timing from the professor panel, so it fits one block or splits across two sessions.
Format
Each student holds the financing, ratings and board roles in turn and submits one target structure.
Level
Adjustable: two financing options on a fixed rating, up to a ratings ladder, leases and a downgrade watch.
Professor tools
Manage students, adjust stage timings, control progression and monitor individual inputs.
Prerequisites
Students need to know debt is cheaper than equity before risk is priced. The shield and the ladder are taught inside.
Delivery
The web-based simulation supports in-person, remote, blended and homework-supported delivery.
Assessment
Every submission is individual, so the target structure, the execution and the review answers export per student.
Course fit
Designed for Capital Structure, Corporate Finance, Financial Management, Valuation and Treasury courses.
The topics a capital structure optimization module has to cover: the interest tax shield, the ratings ladder and the cost of debt, the investment grade boundary, the optimal leverage range, financial flexibility and unused capacity and executing a target structure.
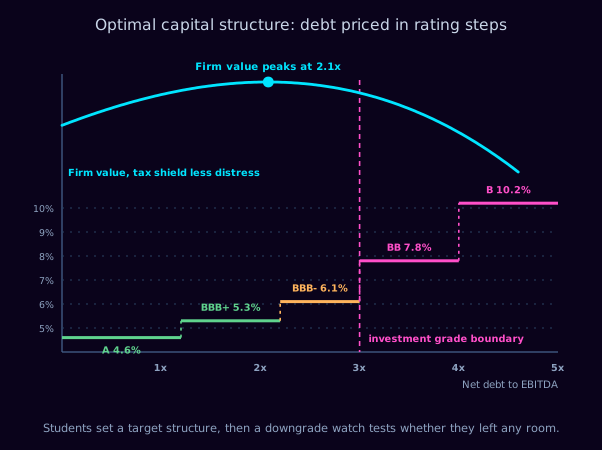
The version of the capital structure picture practitioners actually use. The cost of debt is not a smooth curve in leverage; it is a staircase set by the rating: four point six at single A, five point three at BBB plus, six point one at BBB minus, then a jump to seven point eight at double B that has more to do with which funds may hold the paper than with the credit itself. Firm value above, tax shield less expected distress, peaks around two times and is almost flat for a turn either side, so the optimum is a range.
Written to drop into your module descriptor without rewriting. On completing the simulation, your students will be able to:
Each student runs the balance sheet alone, holding the financing, ratings and board roles in turn. All three want something different from the same leverage, and only one target is approved.
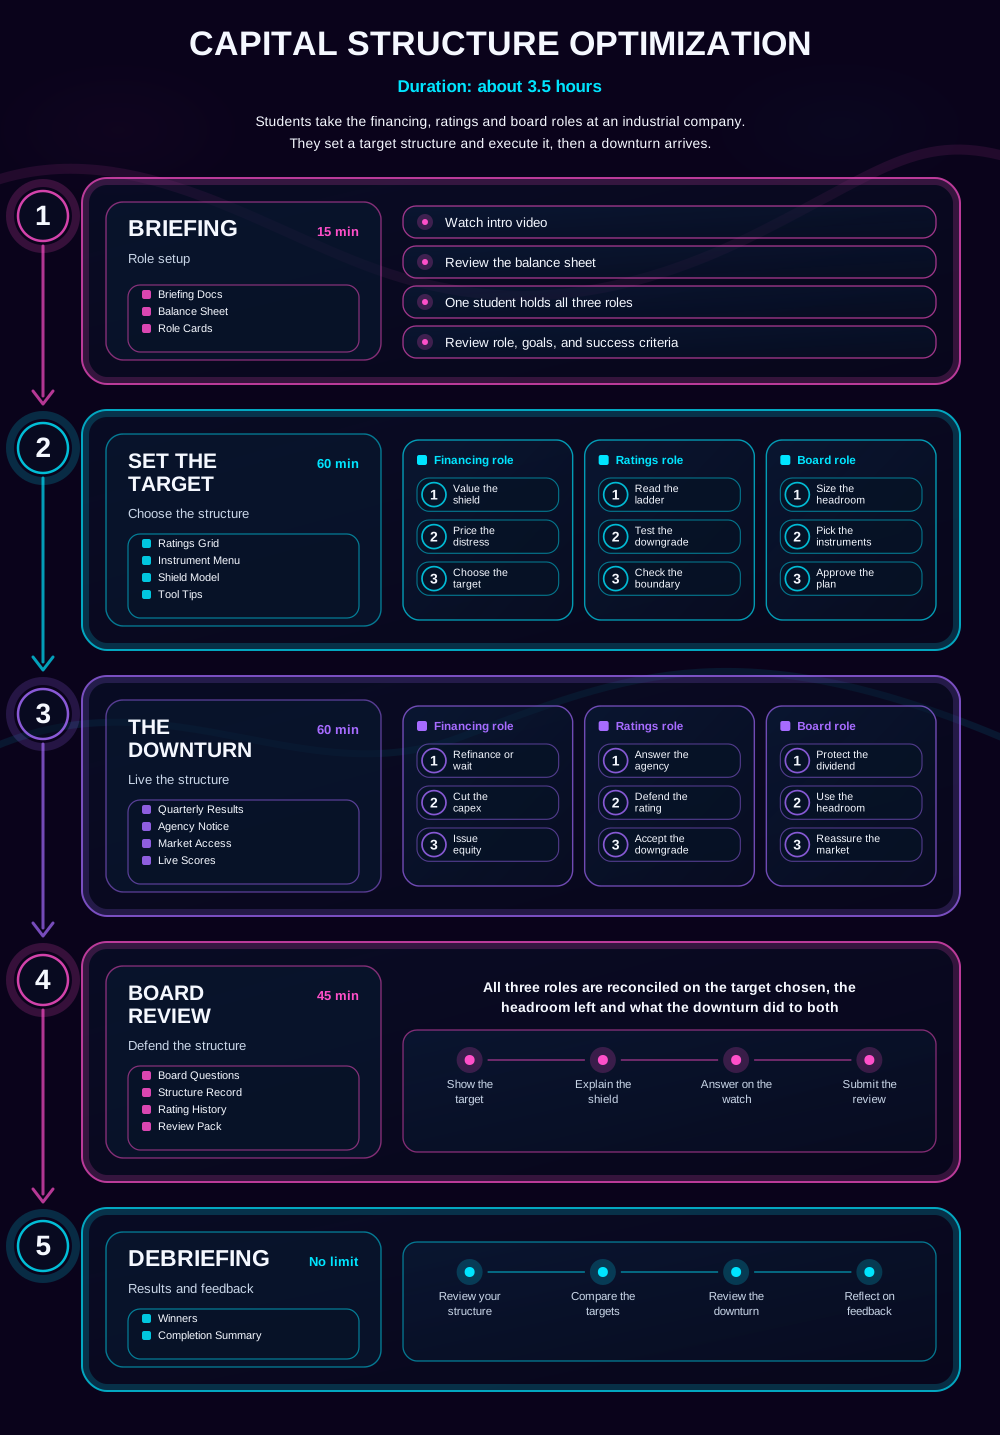
The gameflow every student sees before they start. The three roles come into play during the target setting and the downturn; briefing, the board review and the debrief are worked as a single view. Materials arrive stage by stage: balance sheet and role cards at briefing, then the ratings grid, instrument menu and shield model for the target, then the quarterly results, agency notice and market access once the downturn starts.
Students choose a target leverage and the instruments to reach it, weighing the tax shield against distress costs that bite long before any default.
Students see that the cost of debt is a step function of the rating rather than a smooth function of leverage, and that the biggest step is the investment grade line.
Students decide how much borrowing capacity to leave unused, which costs something now and is the only thing that works in a downturn.
Five stages. Students choose a target leverage against a ratings ladder, execute it, then meet a downturn at the boundary.
Briefing Docs · Balance Sheet · Role Cards
Briefing
Students watch the intro video, review a company at one point two times leverage with a single A rating, and take on all three roles, checking the pension deficit, the lease obligations and the success criteria before any target is set.
Ratings Grid · Instrument Menu · Shield Model · Tool Tips
Set the Target
The target gets set. Working as financing, the student values the tax shield and the distress costs across leverage levels; as ratings, reads the step function and tests what each level implies for the rating; as board, decides how much unused capacity to keep and chooses between a bond issue, a term loan and a buyback to get there.
Quarterly Results · Agency Notice · Market Access · Live Scores
The Downturn
Earnings fall eighteen per cent and the agency puts the company on negative watch at BBB minus, one notch above the boundary. A refinancing is due in fourteen months, the cost of crossing the line is a hundred and seventy basis points, and the actions that protect the rating are the ones that hurt the business.
Board Questions · Structure Record · Rating History · Review Pack
Board Review
Students are asked what the tax shield was actually worth against the cost of the watch, whether the headroom they left was used, what crossing the boundary would have cost on the refinancing, and what target they would set now.
Winners · Completion Summary
Debriefing
Students review their own structure, compare targets across the cohort, revisit the downturn decisions that separated them and reflect on the feedback. Winners and the completion summary give you a structure for the discussion.
The student interface carries the target, the ratings ladder and the reasoning. The professor panel carries the timeline, the controls and every individual structure.
Students work level by level, with the rating each one implies, what it costs and what it does to firm value side by side, and a written reason required for any target within half a turn of the boundary.
The headroom column is the one that matters. It reads USD 240m at the start of the downturn and USD 60m by the watch, and every remaining action is one the business would rather not take.
Your view. Adjust any stage timing, start or stop the session, and see who ran at the theoretical optimum and what the watch left them able to do.
Explore the student and professor experience, and discuss timing, setup and syllabus fit.
It works best as the session that replaces the smooth textbook curve with the staircase lenders use.
That debt looks cheaper than equity. The tax shield, distress costs, the ratings ladder and flexibility are explained inside the activity.
Mid to late module, typically weeks six to ten, after the cost of capital.
Payout policy, leveraged buyouts, debt restructuring, credit ratings methodology, and any assessment asking students to recommend a financing structure.
The capital structure course guide sets out where it sits in a full module.
The three mistakes students make on this case, and what each one gives you in the debrief. Our simulations are designed around them: read the learning science behind it.
1
The value curve is almost flat for a turn either side of the peak, so a target defended to one decimal place is reading precision the model does not contain. The useful output is a range with a reason for its edges.
2
Crossing out of investment grade does not make the company meaningfully riskier on the day it happens; it removes the funds that are permitted to hold the bonds. Understanding that the cliff is about the investor base rather than the credit is what makes the number make sense.
3
Unused borrowing capacity has a cost now and is the only thing that works in a downturn. Every student who runs at the theoretical optimum discovers in the watch stage that the actions available to them are the expensive ones.
The debrief runs itself. Every student sees their results, the cohort comparison and the decisions that produced them, with nothing for you to prepare. If you would rather lead the discussion, these questions work straight from a slide, and they use what your cohort actually did.
Assessment is optional. Run the simulation ungraded as an applied activity, or use platform data as supporting evidence. Every student generates a target structure, an execution plan, downturn decisions and written rationales. Because the simulation is single-player, every input belongs to one named student, so there is no group-work marking to untangle. All of it exports as CSV or PDF, per student, so you can assess reasoning rather than a result.
On generative AI: written rationales are exactly what marking teams now worry about. Because every rationale here is tied to a target the student set inside the platform, with the realised downturn sitting next to it, the reasoning can be checked against the evidence rather than taken on trust.
93% of students rate Finsimco simulations Excellent, across more than 30,000 responses.
Teaching notes, a setup and facilitation guide and a gameflow diagram come with it, and we support your first delivery directly.
Run it ungraded the first time. Assessment is optional and can be added once you have seen how your cohort responds.
Pause or stop at any point and resume later without losing submitted data, so an overrun costs you a timetable slot, not the activity.
Read what lecturers say.
Ron Tuninga, Managing Director for EMEA at AACSB, and Victor Hedenberg, Membership Director at AMBA, on why simulation-based learning belongs in business education. Watch both interviews.
If this one is not quite right for your module, these are the closest alternatives.
A one-page summary of this simulation, covering stages and timings, roles, concepts, learning outcomes and the debrief questions, plus a full sample teaching pack from one of our live simulations, so you can see exactly what you would be running.
During the call, we can:


