Duration
About 3.5 hours
You set every stage timing from the professor panel, so it fits one block or splits across two sessions.
Climate Risk Simulation
The Finsimco Climate Risk Simulation gives each student an industrial group with nine assets, three scenarios and one capital budget. They commit to a path, and the other two then run against the same plan.
Duration
You set every stage timing from the professor panel, so it fits one block or splits across two sessions.
Format
Each student holds the exposure, scenario and capital roles in turn and submits one allocation.
Level
Adjustable: two scenarios on one carbon price, up to a physical damage model, disclosure and a lender test.
Professor tools
Manage students, adjust stage timings, control progression and monitor individual inputs.
Prerequisites
Students need to read a cash flow. Carbon pricing, scenario analysis and stranded assets are taught inside.
Delivery
The web-based simulation supports in-person, remote, blended and homework-supported delivery.
Assessment
Every submission is individual, so the exposures, the capital allocation and the review answers export per student.
Course fit
Designed for Sustainable Finance, Climate Risk, Risk Management, Corporate Finance and Energy Finance courses.
The topics a climate risk module has to cover: transition risk against physical risk, carbon price paths and scenario analysis, stranded assets and the date that creates them, the earnings impact of a carbon price, an orderly against a disorderly transition and climate disclosure and lender stress tests.
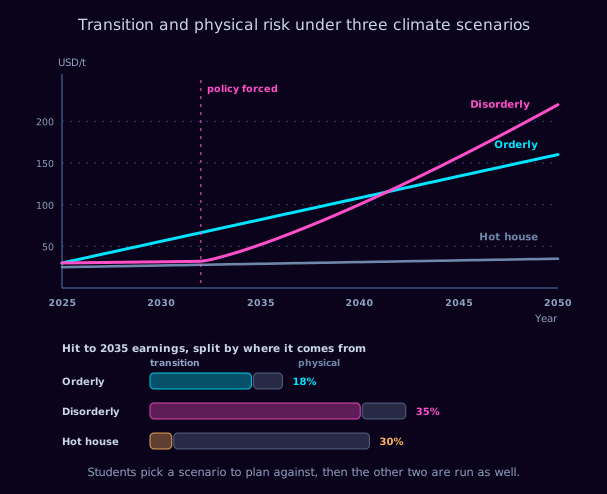
The figure behind every climate disclosure. Three carbon price paths run from today to 2050: an orderly transition rising steadily, a disorderly one that waits until policy is forced and then climbs steeply, and a hot house path that barely moves. The lower panel takes the hit to 2035 earnings under each and splits it between transition cost and physical damage. Orderly is cheapest at eighteen per cent, almost all transition. Disorderly costs thirty-five, because the same adjustment is compressed into half the time. Hot house costs thirty, almost all physical.
Written to drop into your module descriptor without rewriting. On completing the simulation, your students will be able to:
Each student runs the group alone, holding the exposure, scenario and capital roles in turn. All three want something different from the same asset register, and only one allocation is submitted.
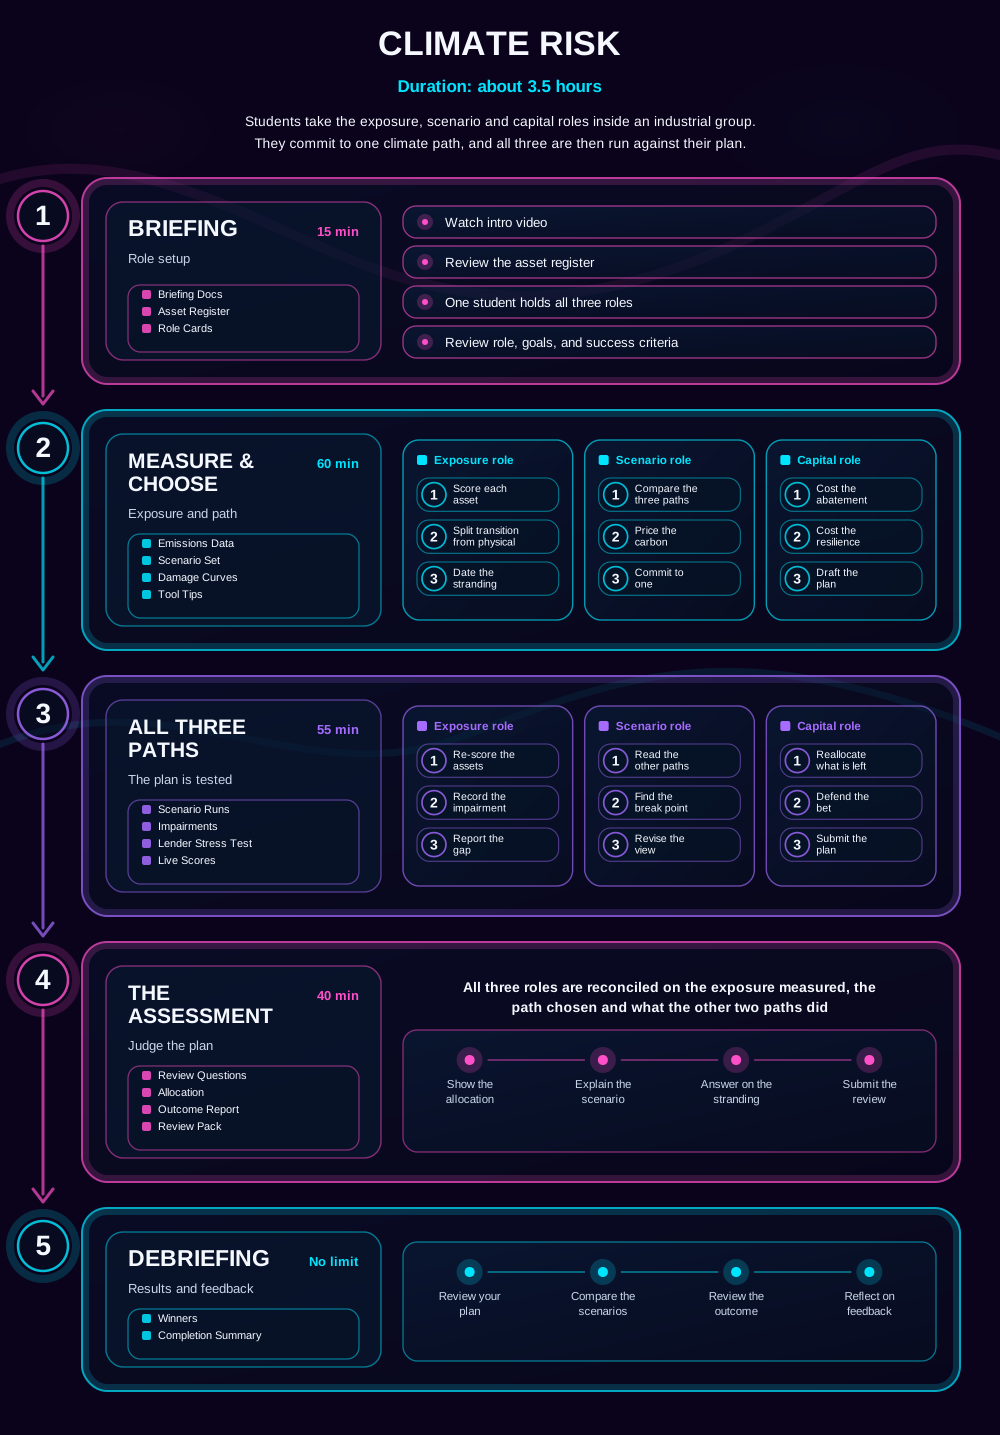
The gameflow every student sees before they start. The three roles come into play during the measurement and the scenario runs; briefing, the assessment and the debrief are worked as a single view. Materials arrive stage by stage: asset register and role cards at briefing, then the emissions data, scenario set and damage curves for the plan, then the scenario runs, impairments and lender stress test once the paths open.
Students work out what each asset is exposed to, split between the cost of the policy response and the cost of the weather, which behave nothing like each other.
Students choose which of three futures the plan is built against, knowing the other two will be run against it as well and that none of them is free.
Students allocate a budget that cannot cover everything, between abatement that pays under one scenario and resilience that pays under another.
Five stages. Students measure exposure, commit capital against one climate path, and then face all three.
Briefing Docs · Asset Register · Role Cards
Briefing
Students watch the intro video, review a group with nine assets across cement, chemicals and logistics in four countries, and take on all three roles, checking the emissions profile, the capital budget and the success criteria before any assessment begins.
Emissions Data · Scenario Set · Damage Curves · Tool Tips
Measure & Choose
The exposure is measured and a path is chosen. Working as exposure, the student scores nine assets on transition and physical risk separately and dates when each becomes unusable; as scenario, compares three carbon price paths and commits to one; as capital, drafts an allocation that cannot cover everything on the list.
Scenario Runs · Impairments · Lender Stress Test · Live Scores
All Three Paths
All three paths run against the same plan. Policy is forced early under one of them, a flood takes a logistics hub under another, a lender applies a climate stress test that the plan was not designed for, and the assets that looked safe on the chosen path are impaired on the other two.
Review Questions · Allocation · Outcome Report · Review Pack
The Assessment
The plan is assessed. Students are asked which scenario they were really betting on, which assets they wrote off too late, how much of the damage was policy rather than weather, and what a plan that performed acceptably under all three would have had to give up.
Winners · Completion Summary
Debriefing
Students review their own allocation, compare scenario choices across the cohort, revisit the impairments that separated them and reflect on the feedback. Winners and the completion summary give you a structure for the discussion.
The student interface carries the exposure, the scenarios and the allocation. The professor panel carries the timeline, the controls and every individual plan.
Students work asset by asset, with transition cost, physical damage and the year the asset becomes unusable side by side, and a written reason required for every stranding date.
The three scenario columns are the point. The asset that is safe under the chosen path is impaired under the other two, and the plan was only funded for one.
Your view. Adjust any stage timing, start or stop the session, and compare which scenario each student committed to with how they fared on the other two.
Explore the student and professor experience, and discuss timing, setup and syllabus fit.
It works best as the session that makes a disclosure framework operational.
How to read a cash flow. Carbon pricing, scenario analysis and physical damage modelling are explained inside the activity.
Mid module, typically weeks five to nine, after the basic risk framework.
Climate disclosure standards, transition finance, carbon markets, insurance and catastrophe modelling, and any assessment asking students to produce a scenario analysis.
The climate risk course guide sets out where it sits in a full module.
The three mistakes students make on this case, and what each one gives you in the debrief. Our simulations are designed around them: read the learning science behind it.
1
No carbon price looks like no cost, so students allocate everything to abatement that only pays under tight policy and nothing to resilience. The flood arrives in year eleven and the logistics hub is not insured for it, which is the single most common failure in the room.
2
An asset is written down when a rule fixes the year it stops being usable, not when a better alternative appears. Students who model the technology and ignore the legislative calendar take the impairment years later than the auditor does.
3
A plan that is excellent under an orderly transition and ruinous under the other two is a bet rather than a strategy. Students rarely price what robustness would have cost, which is the question the board actually asks.
The debrief runs itself. Every student sees their results, the cohort comparison and the decisions that produced them, with nothing for you to prepare. If you would rather lead the discussion, these questions work straight from a slide, and they use what your cohort actually did.
Assessment is optional. Run the simulation ungraded as an applied activity, or use platform data as supporting evidence. Every student generates exposure scores, a scenario choice, a capital allocation, an outcome and written rationales. Because the simulation is single-player, every input belongs to one named student, so there is no group-work marking to untangle. All of it exports as CSV or PDF, per student, so you can assess reasoning rather than a result.
On generative AI: written rationales are exactly what marking teams now worry about. Because every rationale here is tied to an exposure assessment the student recorded inside the platform before the scenarios ran, the reasoning can be checked against the evidence rather than taken on trust.
93% of students rate Finsimco simulations Excellent, across more than 30,000 responses.
Teaching notes, a setup and facilitation guide and a gameflow diagram come with it, and we support your first delivery directly.
Run it ungraded the first time. Assessment is optional and can be added once you have seen how your cohort responds.
Pause or stop at any point and resume later without losing submitted data, so an overrun costs you a timetable slot, not the activity.
Read what lecturers say.
Ron Tuninga, Managing Director for EMEA at AACSB, and Victor Hedenberg, Membership Director at AMBA, on why simulation-based learning belongs in business education. Watch both interviews.
If this one is not quite right for your module, these are the closest alternatives.
A one-page summary of this simulation, covering stages and timings, roles, concepts, learning outcomes and the debrief questions, plus a full sample teaching pack from one of our live simulations, so you can see exactly what you would be running.
During the call, we can:


