Duration
About 3.5 hours
You set every stage timing from the professor panel, so it fits one block or splits across two sessions.
Accounting Fraud Detection Simulation
The Finsimco Accounting Fraud Detection Simulation hands each student eight years of a listed company's accounts. Profit rises every year, cash from operations stops moving in year four, and the explanation has to be evidenced.
Duration
You set every stage timing from the professor panel, so it fits one block or splits across two sessions.
Format
Each student holds the screening, testing and conclusion roles in turn and submits one written conclusion.
Level
Adjustable: one revenue recognition issue with clear evidence, up to a judgemental estimate and a restatement.
Professor tools
Manage students, adjust stage timings, control progression and monitor individual inputs.
Prerequisites
Students need an income statement and a cash flow. Accruals, manipulation indices and digit tests are taught inside.
Delivery
The web-based simulation supports in-person, remote, blended and homework-supported delivery.
Assessment
Every submission is individual, so the screening work, the tests run and the review answers export per student.
Course fit
Designed for Financial Accounting, Auditing, Forensic Accounting and Corporate Governance courses.
The topics an accounting fraud detection module has to cover: earnings quality and the accrual, operating cash flow against reported profit, manipulation indices and digit tests, revenue recognition and capitalised costs, aggressive judgement against misstatement and writing a conclusion the evidence supports.
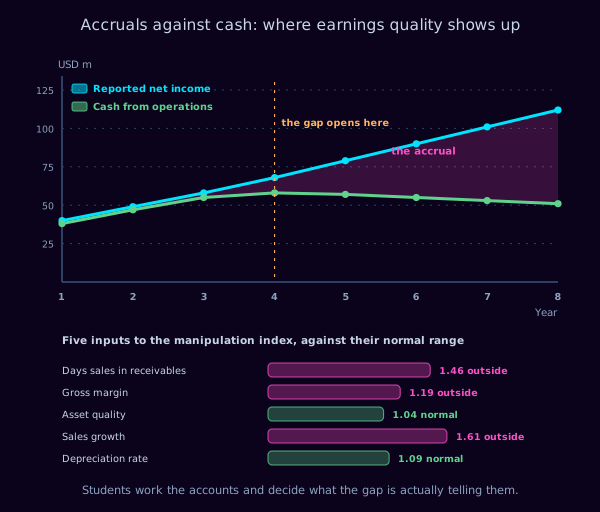
The first chart any forensic analyst draws. Reported net income climbs smoothly from forty million dollars to a hundred and twelve. Cash from operations tracks it for three years, flattens, and ends at fifty-one. The shaded wedge between them is the accrual, and it widens every year from year four. An accrual has to reverse eventually, so the wedge is a loan taken against a future year's earnings. The lower panel scores five inputs to a standard manipulation index, three of them already outside the range a clean company sits in.
Written to drop into your module descriptor without rewriting. On completing the simulation, your students will be able to:
Each student works the file alone, holding the screening, testing and conclusion roles in turn. All three want something different from the same accounts, and only one conclusion is submitted.
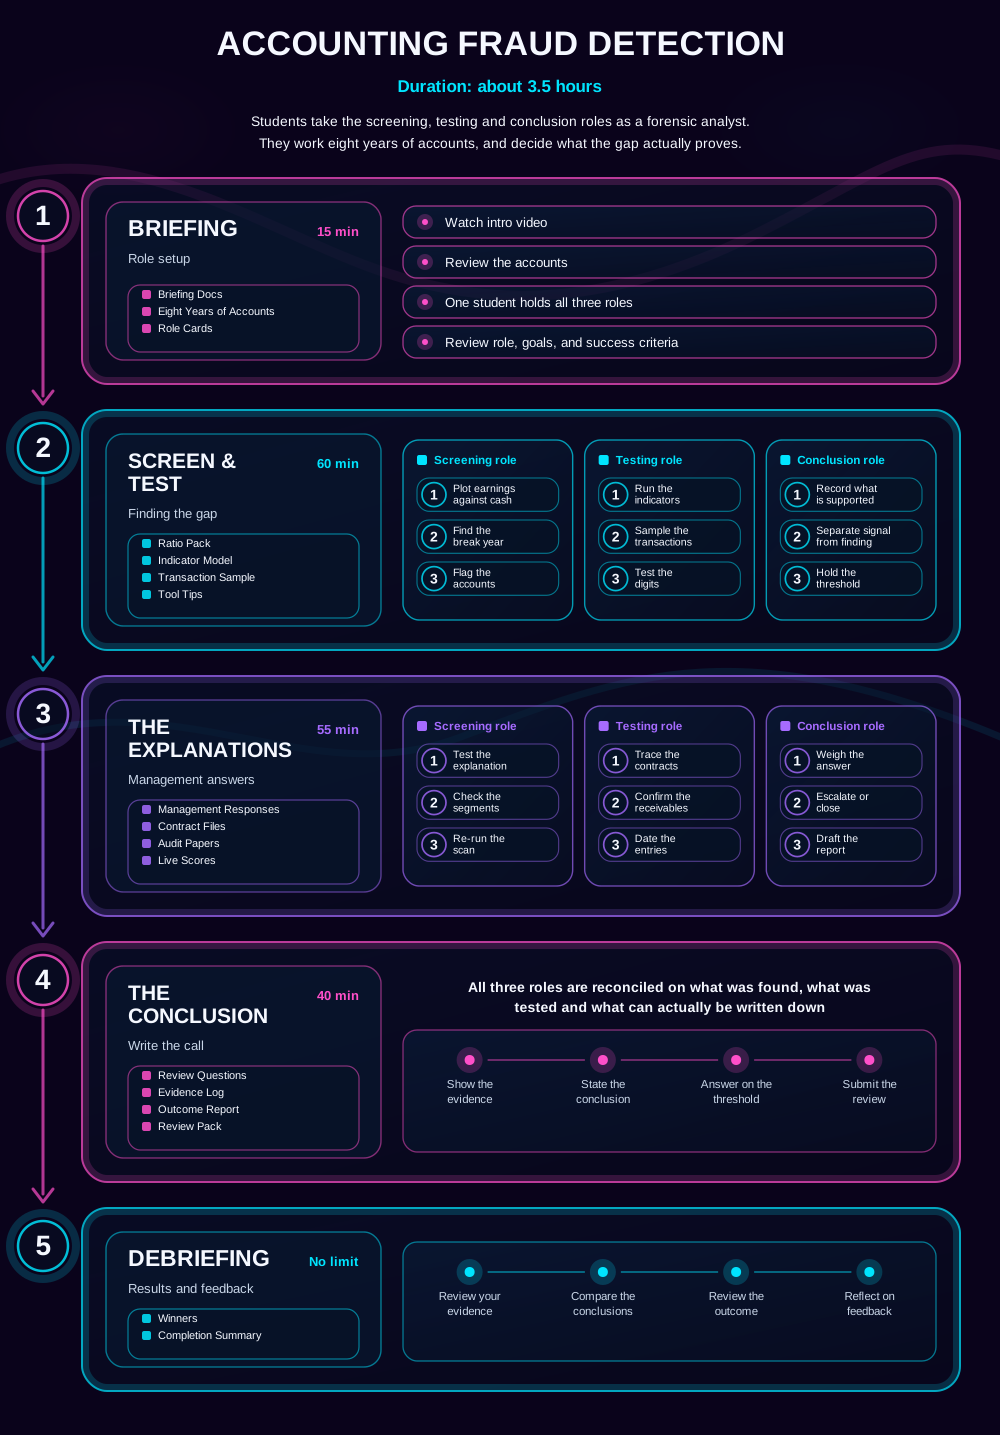
The gameflow every student sees before they start. The three roles come into play during the testing and the explanations; briefing, the conclusion and the debrief are worked as a single view. Materials arrive stage by stage: eight years of accounts and role cards at briefing, then the ratio pack, indicator model and transaction sample for the testing, then management's responses, the contract files and the audit papers.
Students read eight years of accounts to find where the relationships between the statements stop holding, which is where everything else has to start.
Students run the indicators and the transaction-level tests, knowing each one produces a signal rather than a finding.
Students write what the evidence actually supports, because an accusation that cannot be evidenced is worse for everybody than one that is never made.
Five stages. Students screen eight years of accounts, test what they find and write a conclusion they can defend.
Briefing Docs · Eight Years of Accounts · Role Cards
Briefing
Students watch the intro video, review eight years of a listed software and services group with an unbroken record of earnings growth, and take on all three roles, checking the materiality threshold, the evidence available and the success criteria before any test is run.
Ratio Pack · Indicator Model · Transaction Sample · Tool Tips
Screen & Test
The work begins. Working as screening, the student plots earnings against cash and finds the year the two separate; as testing, runs five manipulation indicators and samples the revenue transactions behind them; as conclusion, writes down which of the results are evidence and which are only indications.
Management Responses · Contract Files · Audit Papers · Live Scores
The Explanations
Management answers every point, and the answers are plausible. Growth absorbs cash, a large contract was signed near the year end, a customer is slow rather than doubtful, and the auditor signed it. Two of the explanations survive testing and two do not.
Review Questions · Evidence Log · Outcome Report · Review Pack
The Conclusion
The conclusion is written. Students are asked which year the problem started, which indicator carried real weight, which management explanation they accepted and why, and whether their conclusion would survive being read by the company's lawyers.
Winners · Completion Summary
Debriefing
Students review their own evidence log, compare conclusions across the cohort, revisit the tests that separated them and reflect on the feedback. Winners and the completion summary give you a structure for the discussion.
The student interface carries the accounts, the indicators and the evidence. The professor panel carries the timeline, the controls and every individual conclusion.
Students work year by year, with reported earnings, operating cash flow and the accrual between them side by side, and a written reason required wherever a year is flagged.
The explanation column is the one that matters. Two of the four hold up under testing, which is what makes the conclusion a judgement rather than a calculation.
Your view. Adjust any stage timing, start or stop the session, and compare which year each student flagged with the conclusion they ended up writing.
Explore the student and professor experience, and discuss timing, setup and syllabus fit.
It works best as the session that turns ratio analysis into an investigation.
How to read an income statement and a cash flow statement. Accruals, manipulation indices and materiality are explained inside the activity.
Mid to late module, typically weeks six to eleven, once the statements have been covered.
Audit evidence and sampling, professional scepticism, whistleblowing, enforcement cases, and any assessment asking students to evaluate a set of published accounts.
The fraud detection course guide sets out where it sits in a full module.
The three mistakes students make on this case, and what each one gives you in the debrief. Our simulations are designed around them: read the learning science behind it.
1
The divergence between earnings and cash is where the work starts, not where it ends. Students who treat the chart as the conclusion cannot answer the first question management asks, which is whether anything they found is actually against the rules.
2
A fast-growing business genuinely absorbs cash into receivables and inventory, which is exactly why that explanation is offered and why it holds for four years. The test is whether the absorption is proportionate to the growth, and most students never run it.
3
An indicator outside its range is a reason to look, not a finding. Students who write a conclusion the evidence does not carry produce something a company can dismiss in a sentence, which protects the problem rather than exposing it.
The debrief runs itself. Every student sees their results, the cohort comparison and the decisions that produced them, with nothing for you to prepare. If you would rather lead the discussion, these questions work straight from a slide, and they use what your cohort actually did.
Assessment is optional. Run the simulation ungraded as an applied activity, or use platform data as supporting evidence. Every student generates screening work, indicator results, transaction tests, a written conclusion and rationales. Because the simulation is single-player, every input belongs to one named student, so there is no group-work marking to untangle. All of it exports as CSV or PDF, per student, so you can assess reasoning rather than a result.
On generative AI: written rationales are exactly what marking teams now worry about. Because every rationale here is tied to a test the student ran inside the platform before the explanations arrived, the reasoning can be checked against the evidence rather than taken on trust.
93% of students rate Finsimco simulations Excellent, across more than 30,000 responses.
Teaching notes, a setup and facilitation guide and a gameflow diagram come with it, and we support your first delivery directly.
Run it ungraded the first time. Assessment is optional and can be added once you have seen how your cohort responds.
Pause or stop at any point and resume later without losing submitted data, so an overrun costs you a timetable slot, not the activity.
Read what lecturers say.
Ron Tuninga, Managing Director for EMEA at AACSB, and Victor Hedenberg, Membership Director at AMBA, on why simulation-based learning belongs in business education. Watch both interviews.
If this one is not quite right for your module, these are the closest alternatives.

Reading what the accounts do and do not say.
Learn More
Who decides, and who answers for it.
Learn More
Numbers built for decisions, not for reporting.
Learn More
Cash tied up in the ordinary business.
Learn MoreA one-page summary of this simulation, covering stages and timings, roles, concepts, learning outcomes and the debrief questions, plus a full sample teaching pack from one of our live simulations, so you can see exactly what you would be running.
During the call, we can: