Duration
About 3.5 hours
You set every stage timing from the professor panel, so it fits one block or splits across two sessions.
AI in Financial Decision-Making Simulation
The Finsimco AI in Financial Decision-Making Simulation hands each student a credit model that is right ninety-four per cent of the time and losing nineteen million dollars a year.
Duration
You set every stage timing from the professor panel, so it fits one block or splits across two sessions.
Format
Each student holds the data, threshold and oversight roles in turn and submits one decision policy.
Level
Adjustable: one model on a clean dataset, up to segments, a proxy variable, a regulator and model drift.
Professor tools
Manage students, adjust stage timings, control progression and monitor individual inputs.
Prerequisites
No prior knowledge. Thresholds, precision and recall, error costs and selection bias are taught inside the activity.
Delivery
The web-based simulation supports in-person, remote, blended and homework-supported delivery.
Assessment
Every submission is individual, so the threshold, the oversight policy and the review answers export per student.
Course fit
Designed for Financial Technology, Banking, Data Analytics, Risk Management and Information Systems courses.
The topics an ai in financial decision-making module has to cover: the expected cost of the two error types, the decision threshold, precision and recall against accuracy, selection bias in training data, human oversight and override logs and model drift after deployment.
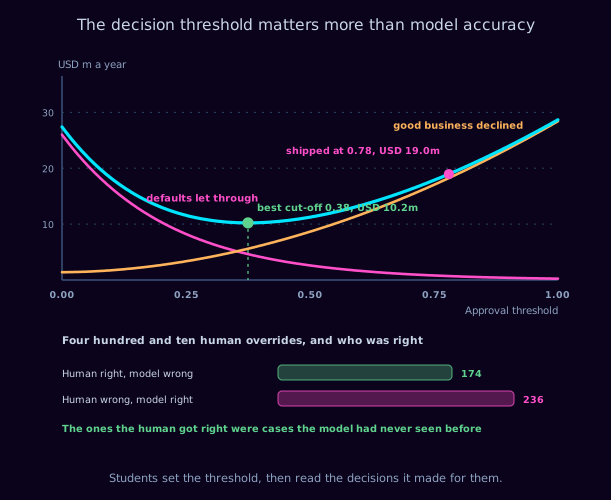
The decision threshold runs from zero to one along the bottom. As it rises the model approves fewer applications, so the cost of the defaults it lets through falls steeply and then flattens, while the cost of the good business it turns away rises throughout. The sum is U-shaped, with a minimum at about zero point three eight costing ten point two million dollars a year, against eighteen point nine at the threshold the model shipped with. Below, four hundred and ten human overrides: the human was wrong more often than right.
Written to drop into your module descriptor without rewriting. On completing the simulation, your students will be able to:
Each student works the model alone, holding the data, threshold and oversight roles in turn. All three want something different from the same model, and only one policy is deployed.
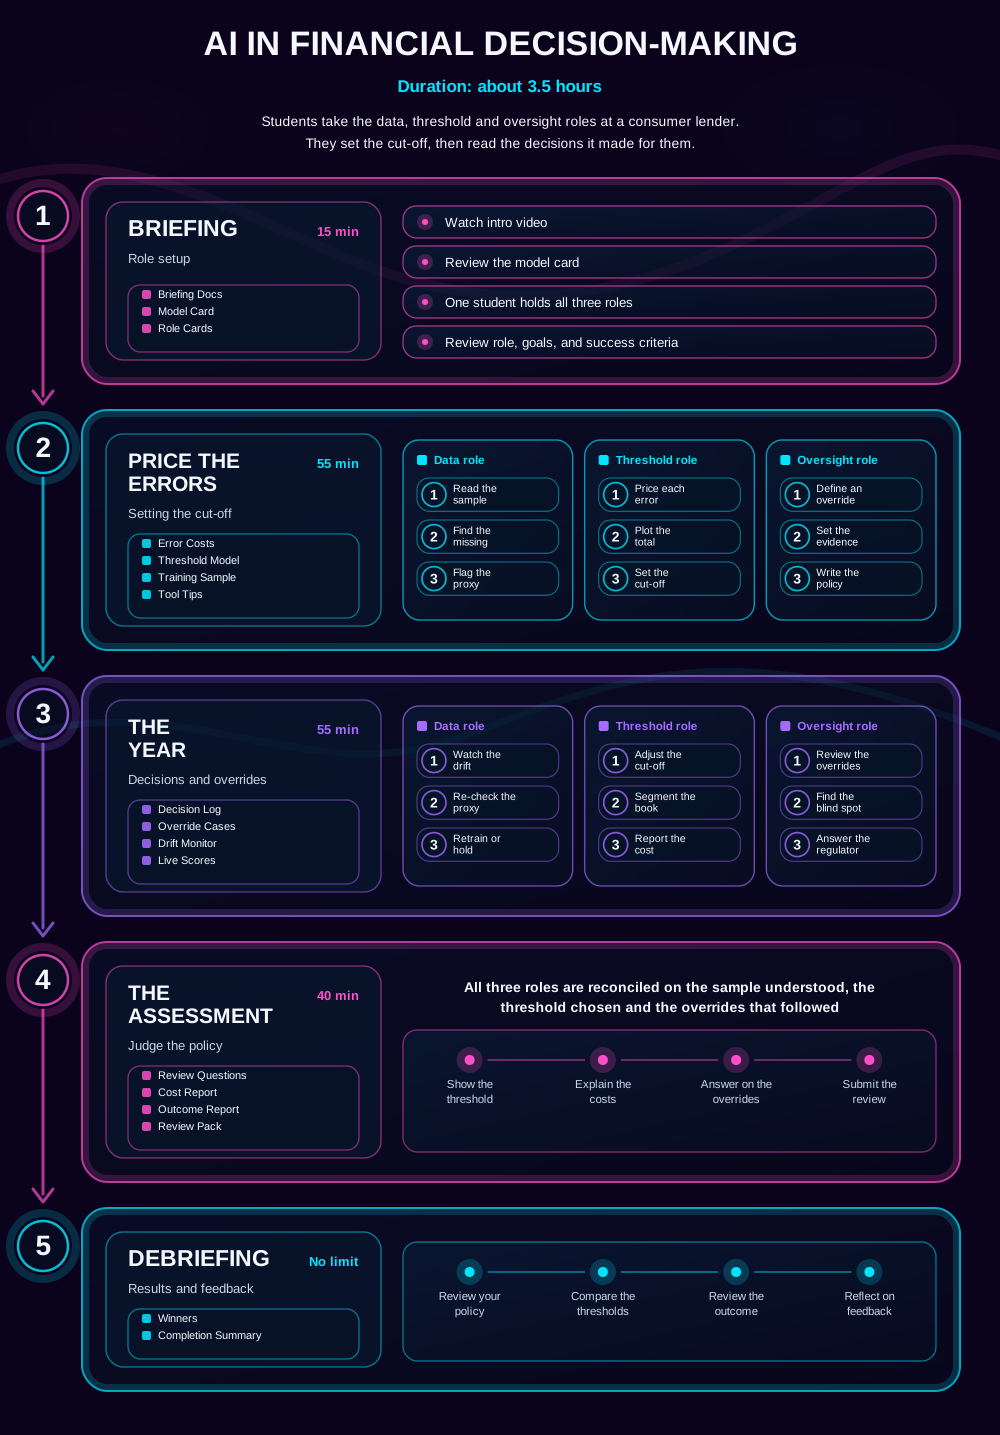
The gameflow every student sees before they start. The three roles come into play while the errors are priced and through the year; briefing, the assessment and the debrief are worked as a single view. Materials arrive stage by stage: model card and role cards at briefing, then the error costs, threshold model and training sample, then the decision log, override cases and drift monitor.
Students establish what the model was trained on, which is a record of applications that were approved and says nothing about the ones that were not.
Students choose where to approve, which is a business decision about the relative cost of two mistakes and is usually left to whoever shipped the model.
Students decide when a person may overrule the model and record what happens, because that log is the only map of where the model is blind.
Five stages. Students price the errors, set the cut-off and read the year of decisions it produced.
Briefing Docs · Model Card · Role Cards
Briefing
Students watch the intro video, review a credit model with a ninety-four per cent accuracy figure, a shipped threshold nobody chose deliberately and a portfolio of four hundred thousand applications a year, and take on all three roles before any decision is changed.
Error Costs · Threshold Model · Training Sample · Tool Tips
Price the Errors
The errors are priced. Working as data, the student finds that the training sample contains only approved applications; as threshold, converts default cost and lost margin into dollars and locates the minimum of the total; as oversight, writes the rule under which a person may overrule the model and what they must record.
Decision Log · Override Cases · Drift Monitor · Live Scores
The Year
A year of decisions runs. Four hundred and ten overrides are logged and the humans are wrong more often than right, but the cases they get right cluster in a population the model never saw. The model drifts in the second half of the year, and a regulator asks why a particular applicant was declined.
Review Questions · Cost Report · Outcome Report · Review Pack
The Assessment
The policy is assessed. Students are asked what their threshold cost against the best available, what the training sample could never have told them, which overrides were worth keeping, and what they would say to the regulator about the declined applicant.
Winners · Completion Summary
Debriefing
Students review their own decision policy, compare thresholds and costs across the cohort, revisit the overrides that separated them and reflect on the feedback. Winners and the completion summary give you a structure for the discussion.
The student interface carries the costs, the threshold and the overrides. The professor panel carries the timeline, the controls and every individual cost report.
Students work cut-off by cut-off, with the approval rate, the cost of defaults let through and the cost of good business declined side by side, and a written reason required for the threshold set.
The override column is the one worth keeping. Humans were wrong more often than right, and the cases they got right were all in a segment the model had never seen.
Your view. Adjust any stage timing, start or stop the session, and compare the threshold each student chose with what their policy cost over the year.
Explore the student and professor experience, and discuss timing, setup and syllabus fit.
It works best as the session that puts a currency on a confusion matrix.
Comfort with percentages and expected values. Thresholds, precision and recall, selection bias and drift are explained inside the activity.
Mid module, typically weeks five to nine, after the basics of modelling.
Model governance, fairness testing, explainability requirements, automated underwriting, and any assessment asking students to appraise a model deployment.
The AI in finance course guide sets out where it sits in a full module.
The three mistakes students make on this case, and what each one gives you in the debrief. Our simulations are designed around them: read the learning science behind it.
1
A better model is the obvious answer and is worth a fraction of what moving the threshold is worth. Students spend the first stage discussing features and the chart at the end shows that the cut-off was carrying almost all of the loss.
2
The model has only ever seen applications that were approved, so it has no evidence about the population it is being asked to judge. Students who do not notice this build a policy on a sample that is systematically missing its own counterexamples.
3
Humans override the model and are wrong more often than right, which makes it tempting to remove the override entirely. The cases they get right are concentrated exactly where the model is blind, and deleting the override deletes the only record of it.
The debrief runs itself. Every student sees their results, the cohort comparison and the decisions that produced them, with nothing for you to prepare. If you would rather lead the discussion, these questions work straight from a slide, and they use what your cohort actually did.
Assessment is optional. Run the simulation ungraded as an applied activity, or use platform data as supporting evidence. Every student generates error costings, a threshold choice, an oversight policy, an outcome and rationales. Because the simulation is single-player, every input belongs to one named student, so there is no group-work marking to untangle. All of it exports as CSV or PDF, per student, so you can assess reasoning rather than a result.
On generative AI: written rationales are exactly what marking teams now worry about. Because every rationale here is tied to a costing the student recorded inside the platform before the year ran, the reasoning can be checked against the evidence rather than taken on trust.
93% of students rate Finsimco simulations Excellent, across more than 30,000 responses.
Teaching notes, a setup and facilitation guide and a gameflow diagram come with it, and we support your first delivery directly.
Run it ungraded the first time. Assessment is optional and can be added once you have seen how your cohort responds.
Pause or stop at any point and resume later without losing submitted data, so an overrun costs you a timetable slot, not the activity.
Read what lecturers say.
Ron Tuninga, Managing Director for EMEA at AACSB, and Victor Hedenberg, Membership Director at AMBA, on why simulation-based learning belongs in business education. Watch both interviews.
If this one is not quite right for your module, these are the closest alternatives.
A one-page summary of this simulation, covering stages and timings, roles, concepts, learning outcomes and the debrief questions, plus a full sample teaching pack from one of our live simulations, so you can see exactly what you would be running.
During the call, we can:


