Duration
About 4 hours
You set every stage timing from the professor panel, so it fits one block or splits across two sessions.
Advanced Corporate Finance Simulation
The Finsimco Advanced Corporate Finance Simulation gives each student a listed group that is under-levered on paper. They locate the trade-off optimum, price what distress actually costs, and explain to a board why the theory and the behaviour disagree.
Duration
You set every stage timing from the professor panel, so it fits one block or splits across two sessions.
Format
Each student holds the structure, distress and signalling roles in turn and submits one recapitalisation plan.
Level
Adjustable: a static trade-off curve, up to a stochastic earnings path, an agency conflict and a signalling market.
Professor tools
Manage students, adjust stage timings, control progression and monitor individual inputs.
Prerequisites
Students need WACC and how leverage moves the cost of equity. The tax shield and distress costs are taught inside.
Delivery
The web-based simulation supports in-person, remote, blended and homework-supported delivery.
Assessment
Every submission is individual, so the target structure, the issuance choices and the review answers export per student.
Course fit
Designed for Advanced Corporate Finance, Corporate Financial Policy, Financial Strategy and Restructuring courses.
The topics an advanced corporate finance module has to cover: trade-off theory, the interest tax shield, direct and indirect costs of distress, pecking order theory, signalling and the issuance decision and debt overhang and the agency conflict.
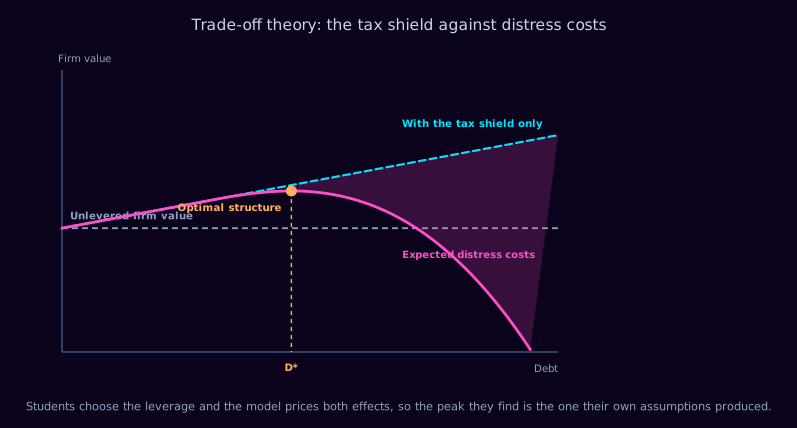
Modigliani and Miller give the flat line. Everything above it is the interest tax shield, everything pulling it back down is the present value of expected distress costs, and the peak where the two balance is the optimum the topic is built around. Two things to take from the shape rather than the formula: the top is flat, so being roughly right is enough and precision is false comfort, and almost all of the distress cost is indirect, which is why it is so easy to assume away.
Written to drop into your module descriptor without rewriting. On completing the simulation, your students will be able to:
Each student runs the policy alone, holding the structure, distress and signalling roles in turn. All three want something different from the same balance sheet, and only one recapitalisation goes to the board.
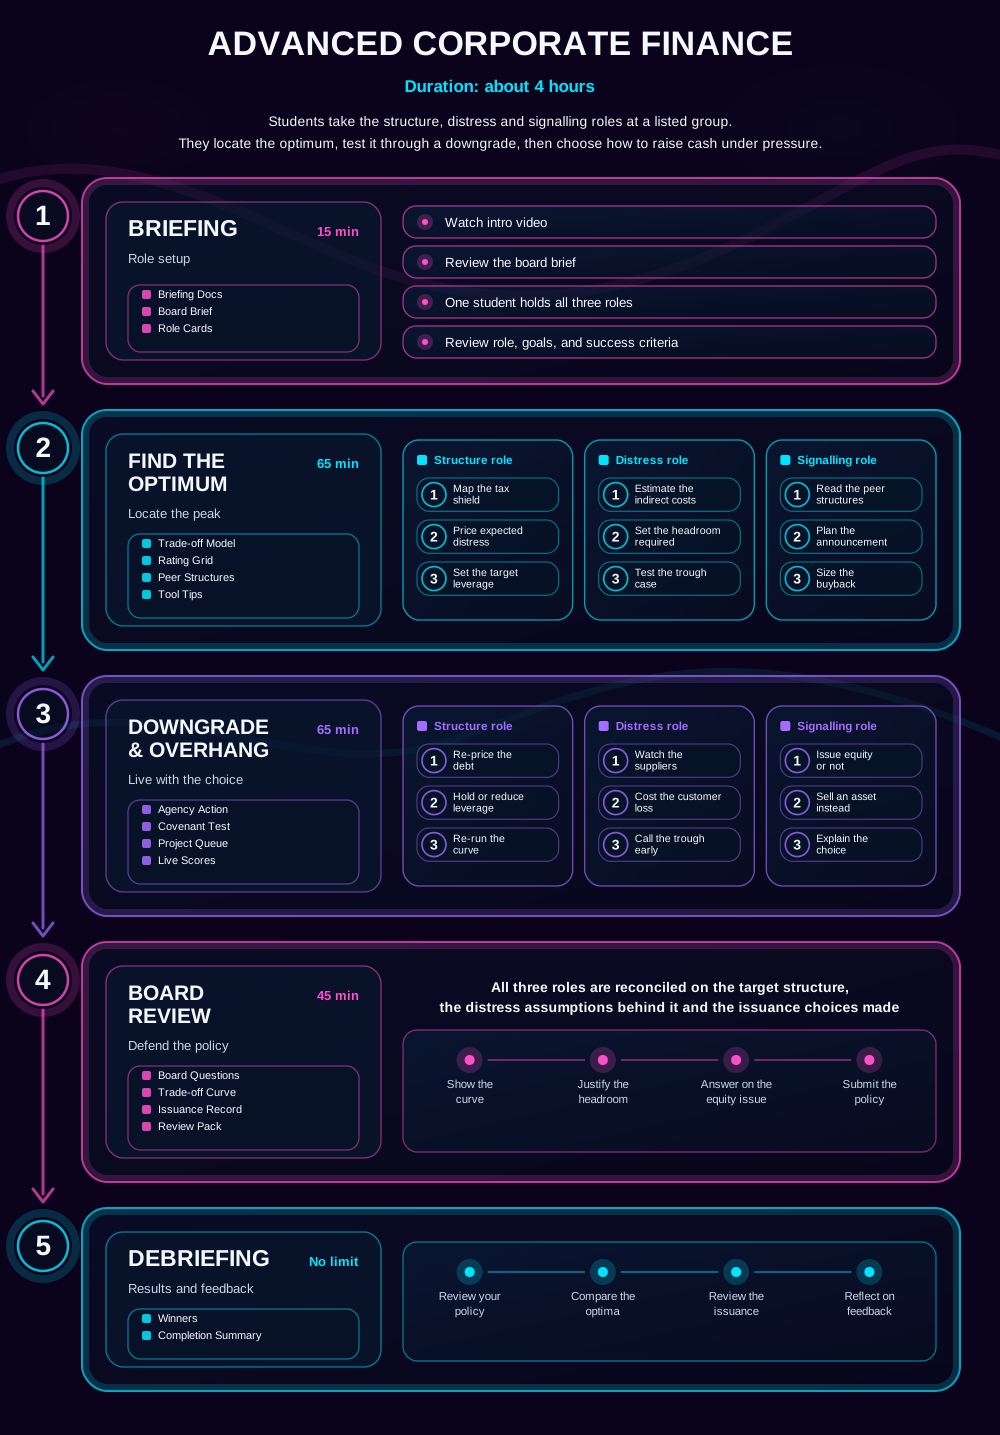
The gameflow every student sees before they start. The three roles come into play during the optimum and the downgrade; briefing, the board review and the debrief are worked as a single view. Materials arrive stage by stage: board brief and role cards at briefing, then the trade-off model, rating grid and peer structures for the target, then the agency action, covenant test and project queue once the downgrade lands.
Students locate the leverage that maximises firm value, and see that the top of the curve is flat enough that precision there is false comfort.
Students price what actually goes wrong before bankruptcy does, which is customers, suppliers and managers rather than lawyers, and decide what headroom is worth.
Students choose between retained earnings, debt and equity when cash runs short, and carry what the choice tells investors about management's own view.
Five stages. Students locate the value-maximising leverage, then find out what a downgrade, a debt overhang and a financing decision do to a structure that was optimal on paper.
Briefing Docs · Board Brief · Role Cards
Briefing
Students watch the intro video, review the board brief and take on all three roles, checking the current structure, the activist letter that prompted the review and the success criteria before any target is set.
Trade-off Model · Rating Grid · Peer Structures · Tool Tips
Find the Optimum
The target gets set. Working as structure, the student maps the tax shield against expected distress and finds the peak; as distress, estimates the indirect costs that make the curve bend; as signalling, decides how the recapitalisation is announced. The plan is submitted with the curve and the chosen point on it.
Agency Action · Covenant Test · Project Queue · Live Scores
Downgrade & Overhang
Earnings miss, the agency downgrades a notch and the cost of debt reprices. A positive net present value project arrives that shareholders will not fund because most of the gain would accrue to the lenders. Cash is short and the three ways to raise it each say something different to the market.
Board Questions · Trade-off Curve · Issuance Record · Review Pack
Board Review
Students are asked where the peak is and how confident they are about it, what the headroom buys at the price it costs, why the project was turned down, and whether the issuance decision was about cash or about what it would signal.
Winners · Completion Summary
Debriefing
Students review their own policy, compare where the cohort placed the optimum, revisit the overhang decision and reflect on the feedback. Winners and the completion summary give you a structure for the discussion.
The student interface carries the curve, the distress assumptions and the reasoning. The professor panel carries the timeline, the controls and every individual policy.
Students work level by level, with the tax shield, the expected distress cost and the firm value they net out to sitting side by side, and a written reason required for the target chosen and for each one rejected.
The right-hand column is the overhang. A project with a positive net present value can still be refused when most of the gain accrues to lenders, and the simulation makes the student say so out loud.
Your view. Adjust any stage timing, start or stop the session, and watch where on the curve each student stood and how much headroom they left themselves.
Explore the student and professor experience, and discuss timing, setup and syllabus fit.
It works best once students have met the trade-off theory and need to find out what it is actually sensitive to.
The weighted average cost of capital and how leverage affects the cost of equity. The tax shield, expected distress costs and the pecking order are computed inside the activity.
Late module, typically weeks eight to twelve, after the introductory capital structure material.
Agency theory, corporate restructuring and distress, payout policy, mergers and acquisitions, and any assessment asking students to recommend a financial policy.
The advanced corporate finance course guide sets out where it sits in a full module.
The three mistakes students make on this case, and what each one gives you in the debrief. Our simulations are designed around them: read the learning science behind it.
1
The optimisation finds a maximum and students report it to one decimal place. The curve around it is almost flat, so a firm two turns either side loses very little value, and the precision implies a confidence the model does not have. Being made to state a range rather than a number is a small change that reframes the whole topic.
2
Bankruptcy fees are a small, observable number, so that is what gets estimated. The expensive part is customers who stop buying, suppliers who shorten terms and managers who stop investing, all of which start long before any filing. The simulation makes those costs arrive first, which is usually the first time a cohort sees distress as an operating event.
3
Three ways to raise the same money look interchangeable on a cash flow statement. Issuing equity when management believes the shares are cheap is a signal, and the market prices it immediately. Students pick the cheapest-looking option and watch the share price react to what the choice revealed.
The debrief runs itself. Every student sees their results, the cohort comparison and the decisions that produced them, with nothing for you to prepare. If you would rather lead the discussion, these questions work straight from a slide, and they use what your cohort actually did.
Assessment is optional. Run the simulation ungraded as an applied activity, or use platform data as supporting evidence. Every student generates a trade-off curve, a target structure, distress assumptions, issuance decisions and written rationales. Because the simulation is single-player, every input belongs to one named student, so there is no group-work marking to untangle. All of it exports as CSV or PDF, per student, so you can assess reasoning rather than a result.
On generative AI: written rationales are exactly what marking teams now worry about. Because every rationale here is tied to a point the student chose on their own curve, with the distress assumptions and the issuance record sitting next to it, the reasoning can be checked against the evidence rather than taken on trust.
93% of students rate Finsimco simulations Excellent, across more than 30,000 responses.
Teaching notes, a setup and facilitation guide and a gameflow diagram come with it, and we support your first delivery directly.
Run it ungraded the first time. Assessment is optional and can be added once you have seen how your cohort responds.
Pause or stop at any point and resume later without losing submitted data, so an overrun costs you a timetable slot, not the activity.
Read what lecturers say.
Ron Tuninga, Managing Director for EMEA at AACSB, and Victor Hedenberg, Membership Director at AMBA, on why simulation-based learning belongs in business education. Watch both interviews.
If this one is not quite right for your module, these are the closest alternatives.
A one-page summary of this simulation, covering stages and timings, roles, concepts, learning outcomes and the debrief questions, plus a full sample teaching pack from one of our live simulations, so you can see exactly what you would be running.
During the call, we can:


