Duration
About 3.5 hours
You set every stage timing from the professor panel, so it fits one block or splits across two sessions.
Central Banking Simulation
The Finsimco Central Banking Simulation seats each student on a policy committee with inflation at seven per cent and a target of two. The transmission lag is longer than the time until the next meeting.
Duration
You set every stage timing from the professor panel, so it fits one block or splits across two sessions.
Format
Each student holds the forecast, decision and communication roles in turn and submits one rate path.
Level
Adjustable: one inflation shock on a given rule, up to supply shocks, an exchange rate channel and guidance.
Professor tools
Manage students, adjust stage timings, control progression and monitor individual inputs.
Prerequisites
No prior economics. Policy rules, output gaps, transmission lags and expectations are taught inside the activity.
Delivery
The web-based simulation supports in-person, remote, blended and homework-supported delivery.
Assessment
Every submission is individual, so the forecasts, the rate decisions and the review answers export per student.
Course fit
Designed for Central Banking, Monetary Economics, Macroeconomics, Financial Markets and Public Policy courses.
The topics a central banking module has to cover: the two-year inflation forecast, policy rules and judgement, the transmission lag, demand shocks against supply shocks, inflation expectations and credibility and forward guidance and the statement.
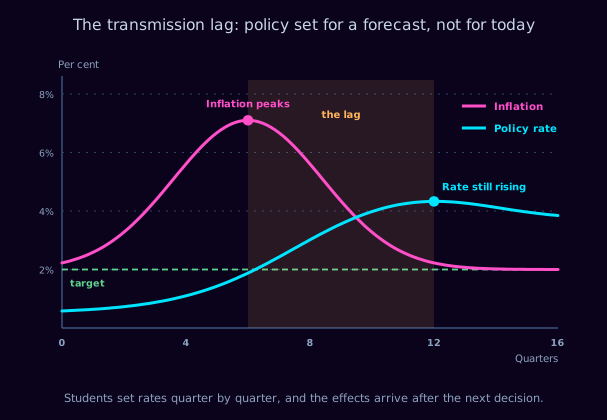
The picture behind every argument about a tightening cycle. Inflation rises to seven per cent, the policy rate is raised in response, and the shaded band is the four to eight quarters between a decision and its full effect. The shape is the point: the rate is still rising after inflation has peaked, because the tightening that eventually brings it back was decided several quarters earlier. A committee setting policy on today's reading is guaranteed to act too late, and the same lag means nobody can later tell whether policy was too tight or merely late.
Written to drop into your module descriptor without rewriting. On completing the simulation, your students will be able to:
Each student runs the committee alone, holding the forecast, decision and communication roles in turn. All three want something different from the same data, and only one rate is announced.
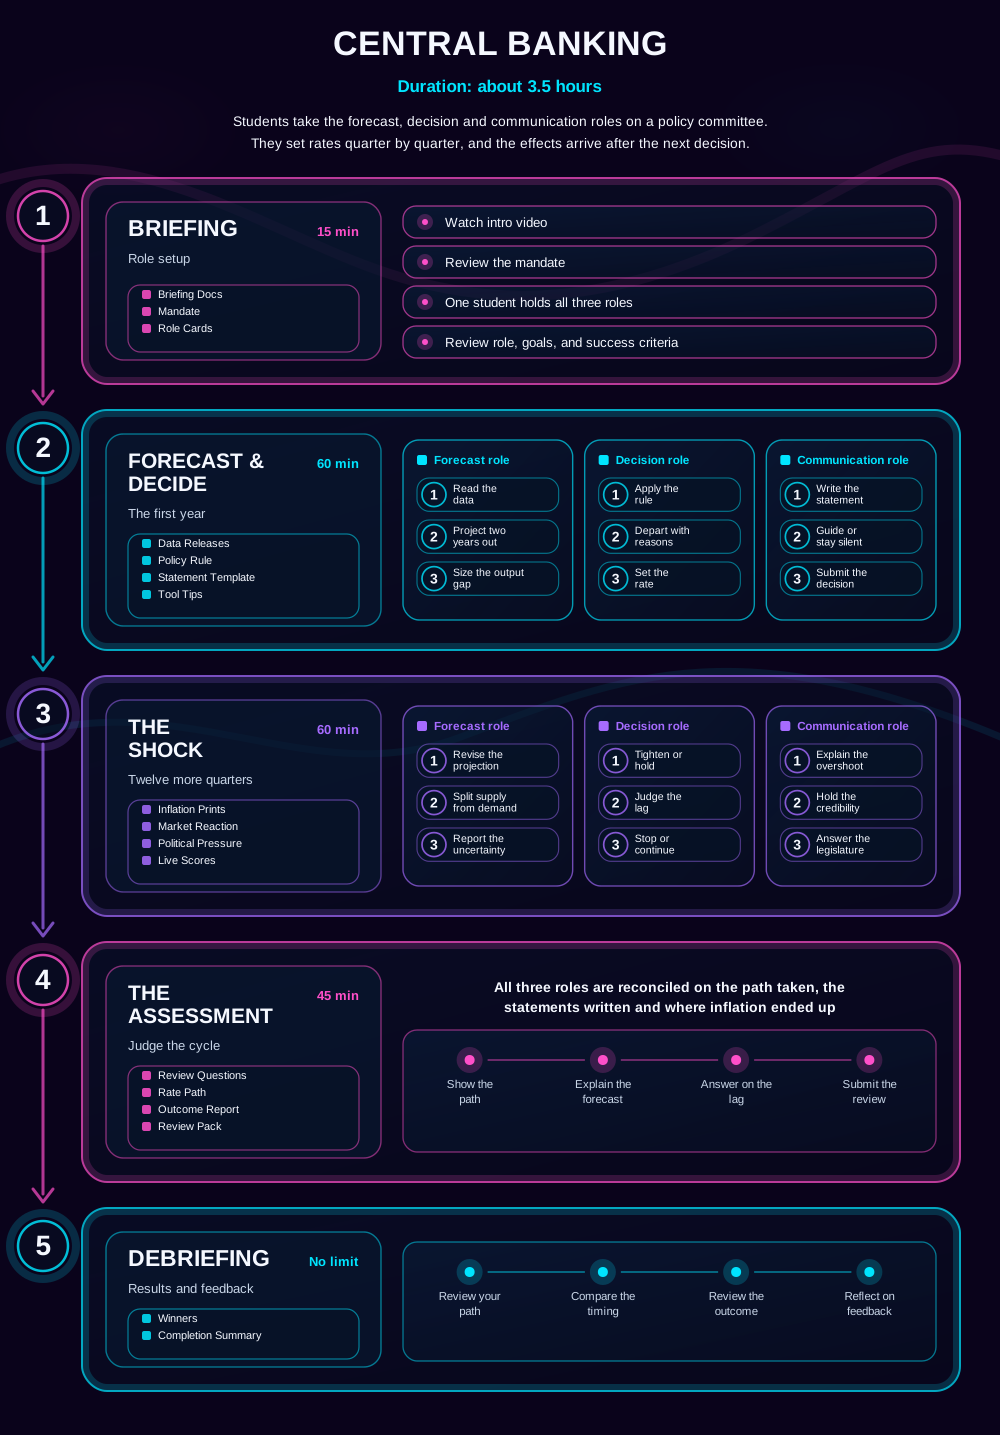
The gameflow every student sees before they start. The three roles come into play during the first year and the shock; briefing, the assessment and the debrief are worked as a single view. Materials arrive stage by stage: mandate and role cards at briefing, then the data releases, policy rule and statement template for the decisions, then the inflation prints, market reaction and political pressure once the shock develops.
Students build a view of inflation and the output gap two years ahead, which is the only horizon on which a rate decision can sensibly be taken.
Students choose how far and how fast to move, knowing the last three decisions have not fully arrived and this one will not for two years.
Students write the statement, because a credible commitment changes wage and price setting before the rate does and costs nothing.
Five stages. Students set rates through sixteen quarters of an inflation shock, with every decision arriving two years late.
Briefing Docs · Mandate · Role Cards
Briefing
Students watch the intro video, review a two per cent inflation target with a secondary employment objective, and take on all three roles, checking the starting position, the data calendar and the success criteria before any rate is set.
Data Releases · Policy Rule · Statement Template · Tool Tips
Forecast & Decide
Four quarters run. Working as forecast, the student projects inflation two years ahead from incomplete and partly revised data; as decision, applies a policy rule and decides where judgement departs from it; as communication, writes a statement that will be parsed word by word and that moves expectations before the rate does.
Inflation Prints · Market Reaction · Political Pressure · Live Scores
The Shock
Inflation reaches seven per cent, partly from an energy shock the committee cannot influence and partly from demand it can. Unemployment starts rising before inflation falls, a legislative committee asks why the bank is causing a recession, and every decision taken so far has still not fully arrived.
Review Questions · Rate Path · Outcome Report · Review Pack
The Assessment
The cycle is assessed. Students are asked when they first moved and what their forecast said at the time, how much of the inflation was supply rather than demand, what the statements did to expectations, and whether their policy was too tight, too loose or simply late.
Winners · Completion Summary
Debriefing
Students review their own rate path, compare timing across the cohort, revisit the outcomes that separated them and reflect on the feedback. Winners and the completion summary give you a structure for the discussion.
The student interface carries the forecasts, the decisions and the statements. The professor panel carries the timeline, the controls and every individual rate path.
Students work indicator by indicator, with today's reading, the two-year forecast and what the rule implies side by side, and a written reason required wherever the decision departs from the rule.
The lag column is the one that matters. Three decisions are still arriving, which is why the rate is rising a year after inflation peaked.
Your view. Adjust any stage timing, start or stop the session, and compare how early each student moved with where inflation ended.
Explore the student and professor experience, and discuss timing, setup and syllabus fit.
It works best as the session that makes the transmission lag concrete.
What inflation and an interest rate are. Policy rules, output gaps, lags and expectations are explained inside the activity.
Mid module, typically weeks five to nine, after the basic macro framework.
Inflation targeting regimes, unconventional policy, financial stability, exchange rate policy, and any assessment asking students to evaluate a monetary decision.
The central banking course guide sets out where it sits in a full module.
The three mistakes students make on this case, and what each one gives you in the debrief. Our simulations are designed around them: read the learning science behind it.
1
Acting on today's inflation reading guarantees acting too late, because the decision takes two years to arrive. The forecast role exists precisely to stop this, and it is the step students skip when a bad number lands.
2
Raising rates does not produce more energy, so a supply shock calls for a different response from a demand shock. Students who tighten the same way into both either strangle the economy or let expectations drift.
3
Expectations respond to a credible commitment before the rate changes anything, so communication is a free instrument and a badly worded sentence undoes a whole tightening. Students treat the statement as an afterthought and then wonder why the yield curve moved against them.
The debrief runs itself. Every student sees their results, the cohort comparison and the decisions that produced them, with nothing for you to prepare. If you would rather lead the discussion, these questions work straight from a slide, and they use what your cohort actually did.
Assessment is optional. Run the simulation ungraded as an applied activity, or use platform data as supporting evidence. Every student generates forecasts, rate decisions, statements, an outcome and written rationales. Because the simulation is single-player, every input belongs to one named student, so there is no group-work marking to untangle. All of it exports as CSV or PDF, per student, so you can assess reasoning rather than a result.
On generative AI: written rationales are exactly what marking teams now worry about. Because every rationale here is tied to a forecast the student recorded inside the platform before the outcome arrived, the reasoning can be checked against the evidence rather than taken on trust.
93% of students rate Finsimco simulations Excellent, across more than 30,000 responses.
Teaching notes, a setup and facilitation guide and a gameflow diagram come with it, and we support your first delivery directly.
Run it ungraded the first time. Assessment is optional and can be added once you have seen how your cohort responds.
Pause or stop at any point and resume later without losing submitted data, so an overrun costs you a timetable slot, not the activity.
Read what lecturers say.
Ron Tuninga, Managing Director for EMEA at AACSB, and Victor Hedenberg, Membership Director at AMBA, on why simulation-based learning belongs in business education. Watch both interviews.
If this one is not quite right for your module, these are the closest alternatives.
A one-page summary of this simulation, covering stages and timings, roles, concepts, learning outcomes and the debrief questions, plus a full sample teaching pack from one of our live simulations, so you can see exactly what you would be running.
During the call, we can:


