Duration
About 3.5 hours
You set every stage timing from the professor panel, so it fits one block or splits across two sessions.
Alternative Investments Simulation
The Finsimco Alternative Investments Simulation gives each student an endowment and four strategies with gentle-looking track records. They set the allocation, and a de-smoothed series arrives after the money has been committed.
Duration
You set every stage timing from the professor panel, so it fits one block or splits across two sessions.
Format
Each student holds the diligence, allocation and committee roles in turn and submits one allocation.
Level
Adjustable: two strategies on given statistics, up to appraisal lags, lock-ups, capital calls and a liquidity test.
Professor tools
Manage students, adjust stage timings, control progression and monitor individual inputs.
Prerequisites
Students need a standard deviation and a correlation. Autocorrelation, de-smoothing and the J-curve are taught inside.
Delivery
The web-based simulation supports in-person, remote, blended and homework-supported delivery.
Assessment
Every submission is individual, so the diligence notes, the allocation and the review answers export per student.
Course fit
Designed for Alternative Investments, Portfolio Management, Asset Management, Investments and Endowment courses.
The topics an alternative investments module has to cover: appraisal smoothing and autocorrelation, de-smoothing a return series, the illiquidity premium, the J-curve, capital calls and liquidity planning and lock-ups and the cost of not being able to sell.
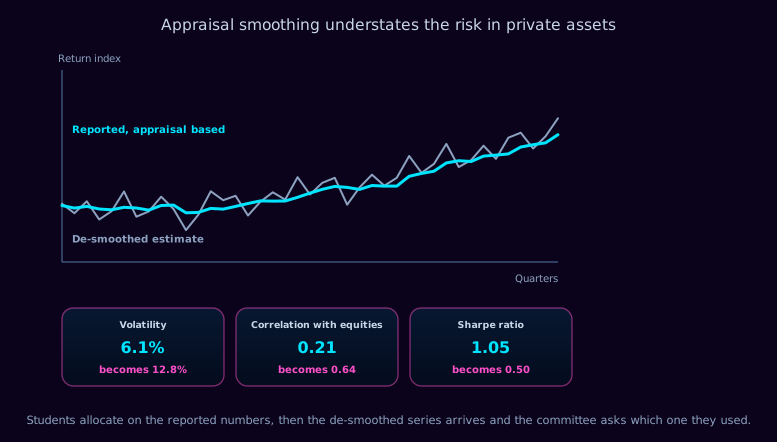
The chart that reframes the asset class. The smooth line is the reported series, produced from valuations set quarterly and anchored on the previous mark; the jagged line is the same asset estimated from transactions. Reported volatility is about half the real figure, the reported correlation with equities less than half, and the Sharpe ratio roughly double. An optimiser fed the reported numbers gives the asset twice the weight it has earned. The premium is real, and it pays for illiquidity rather than for less risk.
Written to drop into your module descriptor without rewriting. On completing the simulation, your students will be able to:
Each student runs the endowment alone, holding the diligence, allocation and committee roles in turn. All three want something different from the same four strategies, and only one allocation is signed.
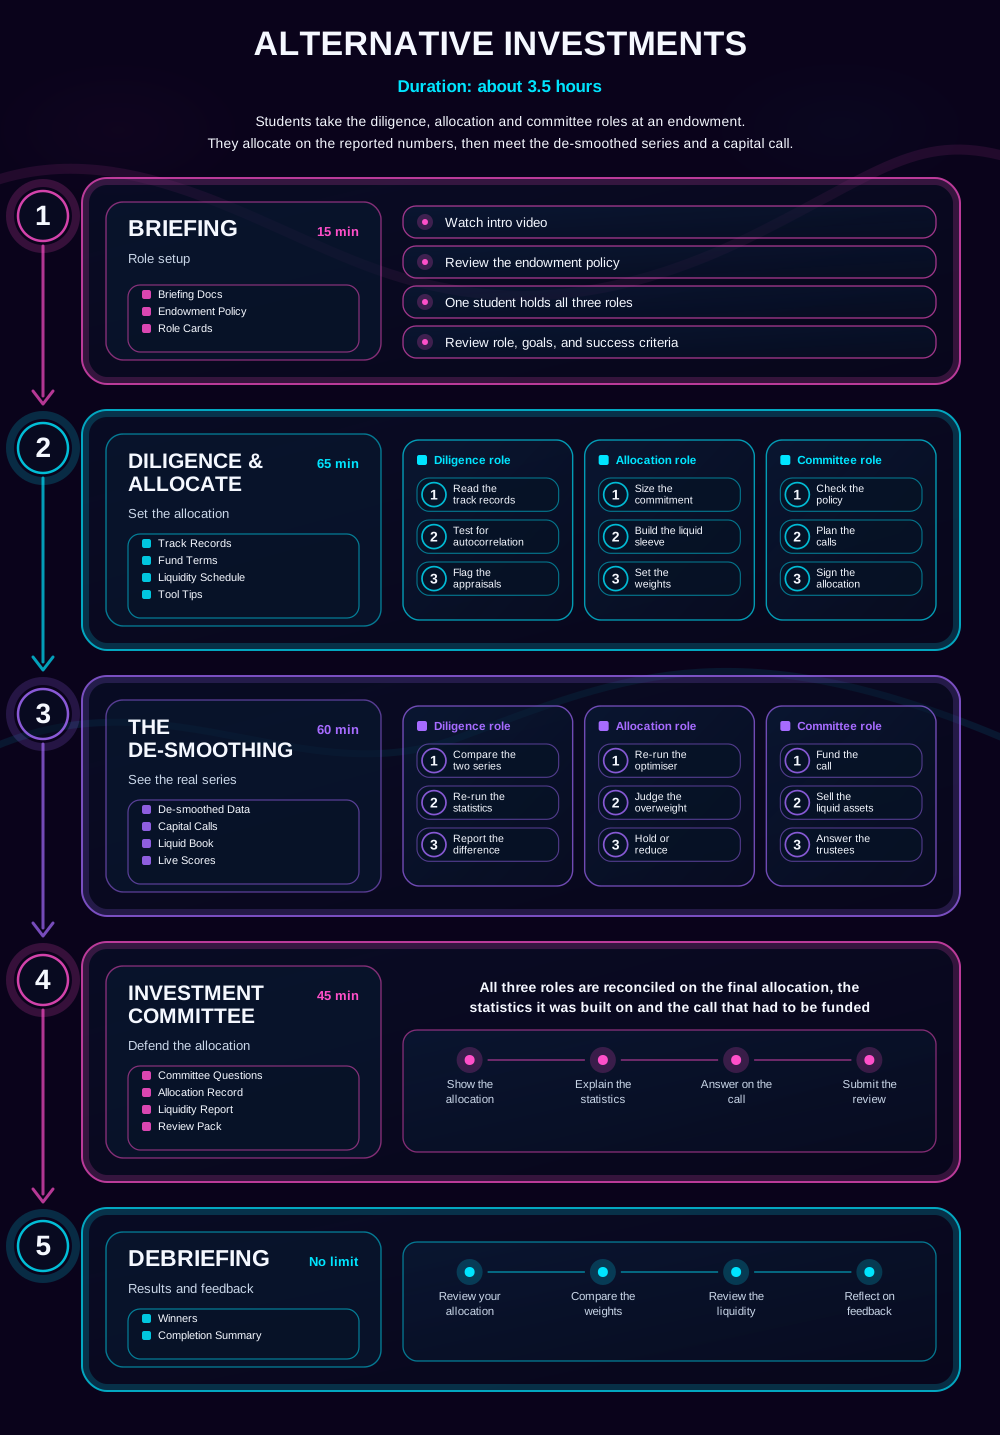
The gameflow every student sees before they start. The three roles come into play during the diligence and the de-smoothing; briefing, the investment committee and the debrief are worked as a single view. Materials arrive stage by stage: endowment policy and role cards at briefing, then the track records, fund terms and liquidity schedule for the allocation, then the de-smoothed data, capital calls and liquid book once the stress arrives.
Students read a track record produced from quarterly appraisals, find the autocorrelation in it, and say what the series would look like if the asset were priced daily.
Students decide how much of the endowment goes into strategies that cannot be sold for years, and what the rest of the portfolio has to look like as a result.
Students explain the decision to people who read the reported Sharpe ratio, and hold the position when a capital call lands in a quarter the liquid book is down.
Five stages. Students allocate on reported returns, then meet the de-smoothed series and a capital call in a falling market.
Briefing Docs · Endowment Policy · Role Cards
Briefing
Students watch the intro video, review the endowment's spending policy and take on all three roles, checking the liquidity requirement, the time horizon and the success criteria before any allocation is made.
Track Records · Fund Terms · Liquidity Schedule · Tool Tips
Diligence & Allocate
The allocation gets set. Working as diligence, the student reads four track records and tests how much of each quarter's return is explained by the previous one; as allocation, sizes commitments to strategies with lock-ups of three to ten years; as committee, checks the result against the spending policy and plans for the capital calls. The allocation is submitted with the reported statistics it was built on.
De-smoothed Data · Capital Calls · Liquid Book · Live Scores
The De-smoothing
The de-smoothed series arrives and the statistics change: volatility roughly doubles, the correlation with equities more than doubles and the Sharpe ratio halves. In the same quarter a capital call lands while public markets are down eleven per cent, so the only assets that can be sold to meet it are the ones that have already fallen.
Committee Questions · Allocation Record · Liquidity Report · Review Pack
Investment Committee
Students are asked which numbers the allocation was built on, what the de-smoothed figures do to the case, whether the premium being earned is for illiquidity or for skill, and what the liquid book had to sell to meet a call that arrived at the worst moment.
Winners · Completion Summary
Debriefing
Students review their own allocation, compare weights across the cohort, revisit the liquidity decisions that separated them and reflect on the feedback. Winners and the completion summary give you a structure for the discussion.
The student interface carries the track records, the allocation and the reasoning. The professor panel carries the timeline, the controls and every individual allocation.
Students work strategy by strategy, with the reported statistics and the autocorrelation in the series side by side, and a written reason required for every commitment above the policy limit.
The two volatility columns are the point. Reported 6.1 per cent, de-smoothed 12.8 per cent, on exactly the same asset over exactly the same period.
Your view. Adjust any stage timing, start or stop the session, and watch which students had to sell equities at the bottom to fund a call they had known about for a year.
Explore the student and professor experience, and discuss timing, setup and syllabus fit.
It works best as the session that explains why alternatives look better on paper than in a portfolio.
Standard deviation, correlation and the idea that a portfolio can be optimised. Autocorrelation, de-smoothing and the illiquidity premium are explained inside the activity.
Mid to late module, typically weeks six to ten, after mean-variance optimisation.
Private equity and venture fund structures, hedge fund strategies, real assets, endowment models, and any assessment asking students to justify an allocation to illiquid assets.
The alternative investments course guide sets out where it sits in a full module.
The three mistakes students make on this case, and what each one gives you in the debrief. Our simulations are designed around them: read the learning science behind it.
1
A quarterly appraisal anchored on the previous mark produces a gentle series regardless of what the asset is doing. Students compute the Sharpe ratio from the reported numbers and allocate accordingly, which is exactly the error the de-smoothing stage is built to expose.
2
The extra return is compensation for not being able to sell, and the moment it is needed is the moment selling is impossible. The capital call in a falling market turns the premium from an abstraction into a forced sale of the liquid book.
3
A commitment is not an allocation: capital is drawn over years, so a portfolio that looks correctly weighted on day one is underweight for three years and then fully weighted at the worst moment. Students who plan the call schedule alongside the weights are the ones still liquid at the committee.
The debrief runs itself. Every student sees their results, the cohort comparison and the decisions that produced them, with nothing for you to prepare. If you would rather lead the discussion, these questions work straight from a slide, and they use what your cohort actually did.
Assessment is optional. Run the simulation ungraded as an applied activity, or use platform data as supporting evidence. Every student generates diligence notes, an allocation, a liquidity plan, decisions on the capital call and written rationales. Because the simulation is single-player, every input belongs to one named student, so there is no group-work marking to untangle. All of it exports as CSV or PDF, per student, so you can assess reasoning rather than a result.
On generative AI: written rationales are exactly what marking teams now worry about. Because every rationale here is tied to a track record the student analysed inside the platform, with the de-smoothed series sitting next to it, the reasoning can be checked against the evidence rather than taken on trust.
93% of students rate Finsimco simulations Excellent, across more than 30,000 responses.
Teaching notes, a setup and facilitation guide and a gameflow diagram come with it, and we support your first delivery directly.
Run it ungraded the first time. Assessment is optional and can be added once you have seen how your cohort responds.
Pause or stop at any point and resume later without losing submitted data, so an overrun costs you a timetable slot, not the activity.
Read what lecturers say.
Ron Tuninga, Managing Director for EMEA at AACSB, and Victor Hedenberg, Membership Director at AMBA, on why simulation-based learning belongs in business education. Watch both interviews.
If this one is not quite right for your module, these are the closest alternatives.
A one-page summary of this simulation, covering stages and timings, roles, concepts, learning outcomes and the debrief questions, plus a full sample teaching pack from one of our live simulations, so you can see exactly what you would be running.
During the call, we can:


